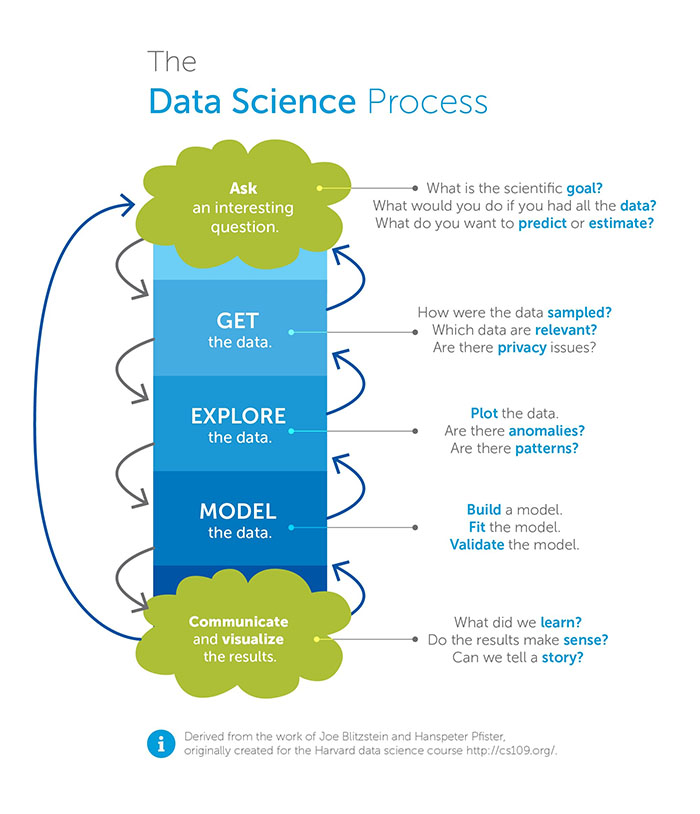
Every day 2.5 quintillion bytes of data are created and stored around the world and with the accelerating growth of Data Science, IoT, Artificial Intelligence and Machine Learning people are understanding the importance of storing data and how important data is for the future. Data Science helps us in understanding the pre-processing of data and how can we convert meaningless data to meaningful data. There are many companies like Intellipaat, who provides data science courses.
What is Data Science?
Data Science with the help of various tools, algorithms help us to deconstruct and find hidden patterns in raw data so that we can do prediction and analysis for different cases.
Data Science is a field where we apply ‘science’ to available ‘data’ in order to get the ‘patterns’ or ‘insights’ which can help a business to optimize operations or improvise decisions.
Let’s Understand Why We Need Data Science
- The data we have traditionally is small in size, It is also well structured and simple so we can easily process it using simple tools. But now with the evolution of Big Data and Machine learning, traditional data has become obsolete.
- A lot of data today is in the form of images, text files, multimedia files, financial logs, sensors, and instruments. So we need more advanced tools and analytical techniques to process this data.
- As of today, Data science has a variety of applications and it is important in many sectors like Healthcare, Travelling, Sales, Marketing, etc.
How Does Data Science Work?
- Discovery: Before you begin the project, it is important to understand the various specifications, requirements, priorities and required budget. You must possess the ability to ask the right questions. Here, you assess if you have the required resources present in terms of people, technology, time and data to support the project. In this phase, you also need to frame the business problem and formulate initial hypotheses (IH) to test.
- Data preparation: In this phase, you require an analytical sandbox in which you can perform analytics for the entire duration of the project. You need to explore, preprocess and condition data prior to modeling. Further, you will perform ETLT (extract, transform, load and transform) to get data into the sandbox. You can use R for data cleaning, transformation, and visualization.
- Here, you will determine the methods and techniques to draw the relationships between variables. These relationships will set the base for the algorithms which you will implement in the next phase. You will apply Exploratory Data Analytics (EDA) using various statistical formulas and visualization tools.
- Model building: In this phase, you will develop datasets for training and testing purposes. You will consider whether your existing tools will suffice for running the models or it will need a more robust environment (like fast and parallel processing). You will analyze various learning techniques like classification, association, and clustering to build the model.
- Operationalize: In this phase, you deliver final reports, briefings, code, and technical documents. In addition, sometimes a pilot project is also implemented in a real-time production environment. This will provide you a clear picture of the performance and other related constraints on a small scale before full deployment.
- Communicate results: Now it is important to evaluate if you have been able to achieve the goal that you had planned in the first phase. So, in the last phase, you identify all the key findings, communicate to the stakeholders and determine if the results of the project are a success or a failure.
Tools Used for Data Science
- SAS
- MS Excel
- SAS
- Apache Spark
- ggplot2
- Tableu


